Our fire and rescue service is stretched to breaking point. The demands on firefighters are rising fast, with climate change creating more extreme wildfires, flooding and severe weather. Yet the service responsible for protecting us is being asked to do more with less.
For over a decade, deep cuts have hollowed out the service. Across the country, fire engines are arriving at emergencies without enough crew on board to respond and save lives. Some engines aren’t leaving the fire station at all because there simply aren’t enough firefighters to staff them.
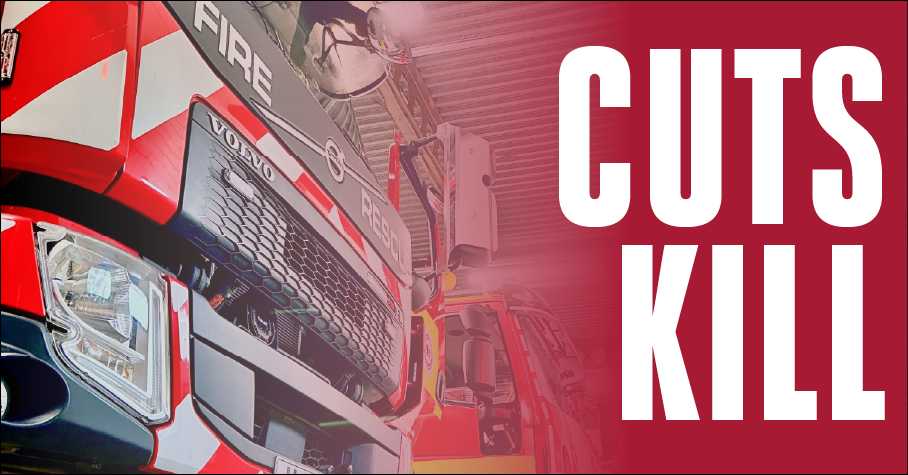
Response times are getting longer every year. And in an emergency, every second counts. Cuts kill.
Firefighters and communities have raised the alarm repeatedly, but those warnings have been brushed aside while politicians made decisions that stripped vital resources from the frontline.
After 14 years of cuts and austerity, it’s time to draw a line in the sand.
The fire service is an all-hazards emergency service. When someone calls 999, they deserve a rapid, fully staffed, full equipped response. Nothing less.
The solution is clear: stop the cuts and start reinvesting in the fire service.
Take a look at how many firefighters your fire service has lost since 2010:
Fire and rescue service | 2010 | 2024 | Change | % | 2024 | 2025 | Change | % | |
Scotland | 7,712 | 6,356 | -1,356 | -18% | 6,356 | 6,366 | 10 | 0.2% | |
Northern Ireland | 1,994 | 1,770 | -224 | -11% | 1,770 | 1,756 | -14 | -0.8% | |
Mid and West Wales | 1,196 | 1,116 | -80 | -7% | 1,116 | 1,143 | 27 | 2.4% | |
North Wales | 883 | 767 | -116 | -13% | 767 | 801 | 34 | 4.4% | |
South Wales | 1,666 | 1,443 | -223 | -13% | 1,443 | 1,452 | 9 | 0.6% | |
Cleveland | 629 | 442 | -187 | -30% | 442 | 436 | -6 | -1.4% | |
Durham | 579 | 512 | -67 | -12% | 512 | 496 | -16 | -3.1% | |
Northumberland | 430 | 332 | -98 | -23% | 332 | 336 | 4 | 1.2% | |
Tyne and Wear | 940 | 637 | -303 | -32% | 637 | 620 | -17 | -2.7% | |
Humberside | 1,053 | 815 | -238 | -23% | 815 | 811 | -4 | -0.5% | |
North Yorkshire | 773 | 635 | -138 | -18% | 635 | 629 | -6 | -0.9% | |
South Yorkshire | 936 | 748 | -188 | -20% | 748 | 747 | -1 | -0.1% | |
West Yorkshire | 1,720 | 1,103 | -617 | -36% | 1,103 | 1,132 | 29 | 2.6% | |
Cheshire | 746 | 659 | -87 | -12% | 659 | 619 | -40 | -6.1% | |
Cumbria | 738 | 583 | -155 | -21% | 583 | 579 | -4 | -0.7% | |
Greater Manchester | 1,992 | 1,403 | -589 | -30% | 1,403 | 1,422 | 19 | 1.4% | |
Lancashire | 1,336 | 1,075 | -261 | -20% | 1,075 | 1,064 | -11 | -1.0% | |
Merseyside | 1,204 | 993 | -211 | -18% | 993 | 975 | -18 | -1.8% | |
Northwest Fire Control | 0 | 67 | 67 | 67 | 64 | -3 | -4.5% | ||
Derbyshire | 779 | 734 | -45 | -6% | 734 | 726 | -8 | -1.1% | |
Leicestershire | 796 | 624 | -172 | -22% | 624 | 655 | 31 | 5.0% | |
Lincolnshire | 757 | 613 | -144 | -19% | 613 | 616 | 3 | 0.5% | |
Northamptonshire | 575 | 464 | -111 | -19% | 464 | 466 | 2 | 0.4% | |
Nottinghamshire | 973 | 658 | -315 | -32% | 658 | 661 | 3 | 0.5% | |
Hereford and Worcester | 723 | 620 | -103 | -14% | 620 | 601 | -19 | -3.1% | |
Shropshire | 573 | 484 | -89 | -16% | 484 | 494 | 10 | 2.1% | |
Staffordshire | 930 | 651 | -279 | -30% | 651 | 677 | 26 | 4.0% | |
Warwickshire | 457 | 429 | -28 | -6% | 429 | 395 | -34 | -7.9% | |
West Midlands | 1,933 | 1,417 | -516 | -27% | 1,417 | 1,444 | 27 | 1.9% | |
Bedfordshire | 499 | 457 | -42 | -8% | 457 | 462 | 5 | 1.1% | |
Cambridgeshire | 695 | 530 | -165 | -24% | 530 | 533 | 3 | 0.6% | |
Essex | 1,415 | 1,176 | -239 | -17% | 1,176 | 1,177 | 1 | 0.1% | |
Hertfordshire | 842 | 725 | -117 | -14% | 725 | 700 | -25 | -3.4% | |
Norfolk | 861 | 816 | -45 | -5% | 816 | 776 | -40 | -4.9% | |
Suffolk | 782 | 600 | -182 | -23% | 600 | 602 | 2 | 0.3% | |
London | 6,018 | 4,737 | -1,281 | -21% | 4,737 | 4,815 | 78 | 1.6% | |
East Sussex | 734 | 552 | -182 | -25% | 552 | 519 | -33 | -6.0% | |
Kent | 1,663 | 1,185 | -478 | -29% | 1,185 | 1,171 | -14 | -1.2% | |
Surrey | 753 | 621 | -132 | -18% | 621 | 605 | -16 | -2.6% | |
West Sussex | 825 | 626 | -199 | -24% | 626 | 608 | -18 | -2.9% | |
Berkshire | 579 | 465 | -114 | -20% | 465 | 483 | 18 | 3.9% | |
Buckinghamshire | 625 | 412 | -213 | -34% | 412 | 435 | 23 | 5.6% | |
Hampshire and Isle of Wight | 1,837 | 1,441 | -396 | -22% | 1,441 | 1,401 | -40 | -2.8% | |
Oxfordshire | 652 | 563 | -89 | -14% | 563 | 540 | -23 | -4.1% | |
Avon | 970 | 726 | -244 | -25% | 726 | 716 | -10 | -1.4% | |
Cornwall | 647 | 576 | -71 | -11% | 576 | 607 | 31 | 5.4% | |
Devon and Somerset | 2,058 | 1,683 | -375 | -18% | 1,683 | 1,646 | -37 | -2.2% | |
Dorset and Wiltshire | 1,297 | 1,007 | -290 | -22% | 1,007 | 981 | -26 | -2.6% | |
Gloucestershire | 523 | 456 | -67 | -13% | 456 | 443 | -13 | -2.9% | |
Isles of Scilly | 51 | 42 | -9 | -18% | 42 | 40 | -2 | -4.8% | |
UK | 59,349 | 47,546 | -11,803 | -20% | 47,546 | 47,443 | -103 | -0.2% |
Join the fight
This fight is for every job, every station and every community. Wherever they try to force through more cuts, we must stand together and push back.
Write to your MP and call on them to sign the Early Day Motion demanding investment in the fire and rescue service.
Find your local fire authority meeting and lobby councillors to stop further cuts and demand the funding from the government our service desperately needs.
Write to your MP and call on them to push for investment to stop cuts and rebuild the fire service.
Fire and rescue services across the country are facing dangerous cuts. Support the campaigns in your area:
Oxfordshire Fire and Rescue Service plans to close three fire stations, remove six fire engines, and cut at least 42 firefighter posts. Under these proposals, only five fire engines will be available at night to cover the whole of the county.
The service is dismantling the on-call duty system by closing two fire stations and removing seven fire engines, leaving rural communities dangerously exposed.
Public safety is being put at risk by plans to close eight fire stations, alongside cutting 96 firefighter posts and 14 fire engines from the frontline.
Firefighters are fighting for funding in the fire service after over a decade of underinvestment, pushing back against cuts to firefighter number and fire cover.